
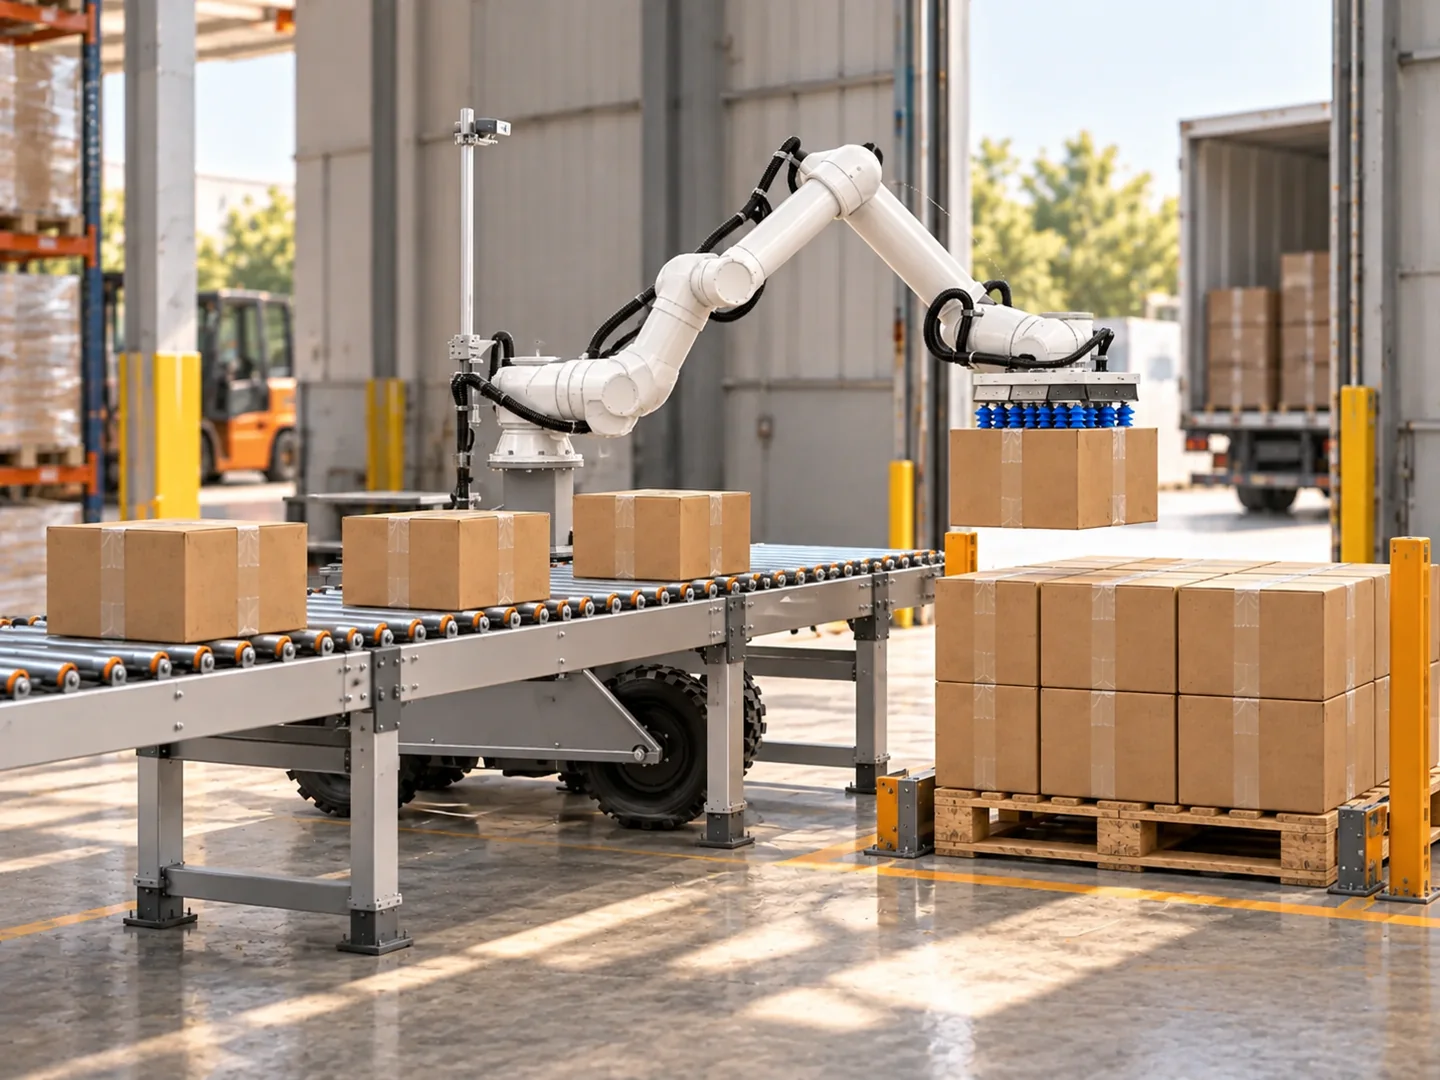
Palletizing robot cycle time describes one part of a receiving line. Daily capacity also depends on carton extraction, presentation, scanning, pallet exchange and the interruptions included in the operating schedule.
Build the estimate from consistent units and defined time windows. The examples below are hypothetical worksheets, not measured KRONA results or promised production rates.
Convert cycle time into active output
If a robot completes one carton every eight seconds under the stated conditions:
Active rate = 60 ÷ 8 = 7.5 cartons per minute
If one cycle completes more than one carton, include the actual batch size. A hypothetical two-carton cycle lasting 12 seconds gives 60 × 2 ÷ 12 = 10 cartons per minute. It does not prove that a particular gripper supports that batch or that every incoming carton can be grouped.
State whether the timed cycle includes approaching, gripping, confirming retention, travelling, releasing and returning. Use the same definition when comparing equipment.
Find the limiting stage
For a simple serial line with consistent carton counts, compare the available capacities of each stage. The slowest stage sets an upper planning bound before additional interruptions and interactions are considered.
| Stage | Hypothetical active capacity | Question to validate |
|---|---|---|
| Carton extraction | 8 cartons/minute | Does the real freight permit this sustained extraction rate? |
| Receiving and inspection | 6 cartons/minute | Can the shift maintain that rate for the actual carton mix? |
| Downstream palletizing | 7.5 cartons/minute | Does the cycle include the required placement positions? |
| Simple serial-line bound | 6 cartons/minute | What further losses occur when the stages operate together? |
The extraction and palletizing stages cannot make this example line complete more than its receiving stage accepts. Faster robot motion may increase waiting rather than final output.
The palletizing cell guide helps define the station layout. For different carton identifiers and arrival sequences, also review mixed-case palletizing.
Separate scheduled time from flow losses
Consider an eight-hour shift: 480 minutes. Suppose 60 minutes are unavailable for scheduled preparation, breaks and planned end-of-shift work. That leaves a 420-minute production window.
Now assume a hypothetical 75% flow factor within that window for pallet exchange, exceptions and other interruptions not already excluded. Applying it to the six-carton/minute line bound gives:
Estimated shift output = 420 × 6 × 0.75 = 1,890 cartons
The effective average over the full eight-hour shift is 1,890 ÷ 480 ≈ 3.94 cartons/minute. It differs from both the active palletizing rate and the uninterrupted line bound.
Do not subtract the same stop twice. If an observed rate already includes pallet exchange or assistance, do not apply another factor for those same activities. Prefer measured time categories to a single assumed percentage once pilot data are available.
Calculate what a temporary buffer can absorb
If an upstream stage delivers eight cartons/minute while the downstream stage completes six, the queue grows by two cartons/minute. A buffer with 20 usable carton positions would absorb that imbalance for approximately 10 minutes, starting empty and assuming those rates remain constant.
During a complete downstream stop, the same buffer receiving eight cartons/minute fills in 2.5 minutes. These calculations concern carton positions, not conveyor metres: actual storage capacity depends on box lengths, gaps and the receiving design.
Once the buffer fills, the upstream process must follow its agreed waiting or fault sequence. Extra accumulation cannot resolve a permanently slower downstream station.
Estimate loads and daily scheduling separately
If cartons must be reordered for a mixed pallet, rate and downtime calculations are only part of the buffer brief. The timed mixed-case sequencing guide compares arrivals against placement order, service time and retrieval access. Use that trace to establish which cartons wait together, then check the physical storage arrangement.
At an assumed completed-line rate of six cartons/minute, 1,500 eligible cartons require 250 minutes of uninterrupted flow. That figure excludes preparation, unavailable freight, stops, final clearance and any activities outside the defined boundary.
Whole-container unload time and dock occupancy therefore need separate measurements. A daily robot schedule must also account for arrival overlap, movement between docks and the downstream line’s availability.
Record carton count, time window, active motion, receiving waits, assistance, pallet exchange and preparation as separate worksheet entries. Add a source beside every figure: observation, supplier specification or planning assumption.
Convert finished-pallet removal into a line bound
The cell can stop when no usable pallet position remains, even if its arm and carton conveyor are ready. Include transport from the collection point to an available destination and the return to a ready state. Use the complete task cycle, including the delays counted in that measurement.
Hypothetical steady-flow example: a cell completes six cartons per minute, with 120 cartons on each accepted pallet. It produces 360 cartons per hour, or three pallets per hour. Suppose one pallet-transport resource completes its full collection, delivery and ready cycle every 25 minutes:
Transport planning capacity = 60 ÷ 25 = 2.4 pallets/hour
Carton-equivalent bound = 2.4 × 120 = 288 cartons/hour = 4.8 cartons/minute
These are illustrative planning inputs, not KRONA forklift or palletizing performance. Under those simplified assumptions, pallet transport cannot keep pace with the cell indefinitely. More waiting positions absorb a temporary gap but do not remove the sustained mismatch.
If a measured transport cycle already includes queueing or charging, do not subtract the same delay again. If it excludes them, show their effect separately. Shared vehicles, different pallet sizes and mixed routes need their own observations rather than one fixed carton-per-pallet conversion.
Use the KRONA warehouse AGV system assessment to connect the pallet-removal task to the receiving line. The autonomous forklift application page owns vehicle selection; this calculation only translates an agreed task cycle into a comparable flow measure.
Validate the estimate in the actual application
Use the pilot checklist to compare the planned flow with representative loads. Report both sustained output and exception activity, rather than presenting only the fastest cycle.
KRONA U1’s up-to-10-boxes/minute specification is a maximum for the complete robot. It is not guaranteed end-to-end receiving output. Send your freight and line assumptions for a site assessment, then use the financial calculator with confirmed coverage and operating-time inputs.
For booking windows, use the complete container unloading-time guide. Test the arrival pattern separately with the peak container capacity guide.
- palletizing
- container unloading
- deployment planning
KRONA U1 unloads boxes from containers onto pallets or conveyors and also loads containers with boxes from pallets or conveyors. Explore KRONA U1 →
Assess your unloading and receiving capacity